Packet loss and performance
Measure where packets disappear before changing thread, memory or ruleset settings.
Examples target Suricata 8.0.1 on a prepared Linux lab host. Constructed outputs are illustrative, not live sensor results. Commands are lesson examples; no sensor or enforcement is started by this page.
Map the processing chain
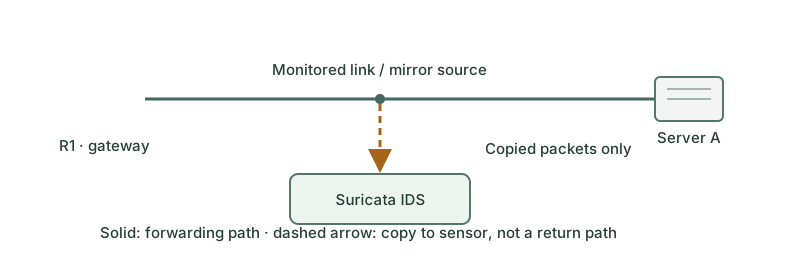
Traffic crosses several stages: source mirror or TAP, NIC queues, kernel capture buffers, Suricata decoding/stream/detection, then output storage. In inline mode there is also the verdict and transmit path. A packet lost at an upstream mirror never appears in the sensor’s capture-drop counter.
Use interval deltas, not unrelated totals
jq -c 'select(.event_type=="stats") | {capture:.stats.capture,decoder:.stats.decoder}' /var/log/suricata/eve.json
{"capture":{"kernel_packets":100000,"kernel_drops":1000},"decoder":{"pkts":99000}}
These are illustrative cumulative counters for a backend exposing these names. Compare two samples from the same run. If an interval adds 10,000 kernel packets and 100 kernel drops under that backend’s definitions, the indicated capture loss fraction is 1%; it is not an end-to-end loss measurement.
Find the bottleneck
| Observation | Likely next investigation |
|---|---|
| Mirror source discards | Oversubscription and source selection |
| NIC errors or ring drops | Link health, driver queues and host load |
| Kernel capture drops rise | Capture capacity and processing backlog |
| Stream gaps or memcap events | Missing directions, memory pressure and stream limits |
| Output delay or disk pressure | Logger selection, storage capacity and downstream ingestion |
Counter meanings vary by capture backend and software version. Do not add unrelated drop counters into a fictitious percentage. Decoder anomalies do not automatically equal packet loss or malicious traffic.
Change one bottleneck at a time
Use representative packet sizes, concurrent flows, protocols and the intended ruleset. A throughput number from empty rules or a single large-packet stream is not a production capacity guarantee. Check CPU distribution, NIC queue/worker affinity and flow-consistent capture before increasing thread counts. Fragments and bidirectional flows must stay correctly associated.
Adjust documented memory and capture settings only with baseline evidence. More buffering can absorb bursts but cannot fix sustained overload. Reduce unnecessary output and overly broad expensive rules while preserving required detection. Re-run positive and negative detection fixtures after each change.
Define a useful acceptance test
| Dimension | Record |
|---|---|
| Traffic | Packet rate, bytes, flow count and protocol mix |
| Detection | Expected positive and negative results |
| Loss | Per-stage deltas and capture gaps |
| Latency | Application measurements for inline mode |
| Availability | Restart and failure behavior |
| Storage | Event delay, retention and disk headroom |
Retain configurations, ruleset versions and measured duration with every result. A sensor that forwards faster because it no longer inspects required traffic has not passed the monitoring goal.
Further reading
Key Takeaways
- Loss can occur before, inside or after sensor capture.
- Use same-run counter deltas and backend-specific meanings.
- Packet rate, flow count and rule cost matter beyond bandwidth.
- Tune one measured bottleneck while preserving flow consistency.
- Capacity acceptance includes detection, loss, latency and availability.