RMON statistics
Keep interval-based interface evidence instead of relying on a single counter snapshot.
Independent lab examples; selected output and frame summaries are illustrative. Port naming and command support vary by switch and software release.
Network and objective
Legacy IOS Catalyst RMON collection example on a platform supporting rmon promiscuous and history collection. Modern platforms may expose telemetry or SNMP counters instead; support is not universal.
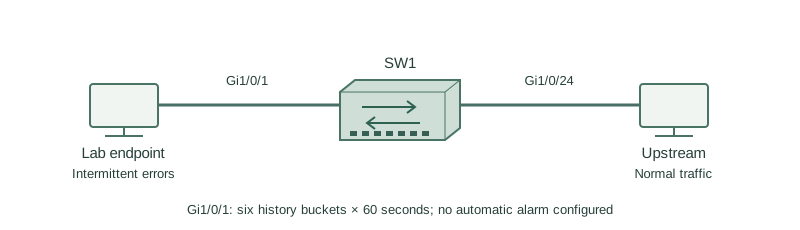
SW1 Gi1/0/1 connects to a lab endpoint with intermittent errors. Collect six 60-second buckets so a short burst can be distinguished from the interface’s accumulated lifetime counters.
How it works
RMON statistics and history summarize observed traffic. An interval can show whether errors rose together with utilization or packet-size changes. A single total since boot cannot show exactly when those errors occurred.
On the legacy implementation shown, native monitoring focuses on traffic addressed to the interface, while promiscuous collection observes traffic available on the monitored segment/interface. It does not magically expose unrelated switched traffic from every port.
History, alarms, and events are different functions. History stores interval samples; alarms compare selected variables with thresholds; events define notification or logging behavior. This lab configures history only and does not claim that it automatically generates a threshold alert.
Configure or inspect
interface GigabitEthernet1/0/1
 rmon promiscuous
 rmon collection history 1 buckets 6 interval 60 owner LAB
Verify the result
SW1#show rmon history
History 1 is active, owned by LAB
Data source is interface GigabitEthernet1/0/1
Requested buckets: 6
Granted buckets: 6
Interval: 60 seconds
Recent sample: 1200 packets, 4 CRC/alignment errors
Requested and granted storage can differ; check both. Six 60-second buckets give about six minutes of retained interval coverage when fully populated, not permanent storage. Export evidence before the rolling history overwrites it.
Failure and recovery
A five-minute burst is missed because the collection interval is 1800 seconds and only an averaged long sample is reviewed.
Choose a shorter supported interval and adequate bucket count, correlate RMON with interface counters and logs, and inspect cable/duplex/physical errors. On a platform without this collection feature, use supported telemetry or SNMP history collection rather than unsupported commands.
Further reading
Key Takeaways
- History records time intervals.
- Total counters do not locate a burst in time.
- Requested storage may exceed granted storage.
- Promiscuous does not reveal every switch port.
- Alarms/events are separate from history.